This walkthrough demonstrates how Slide Set can be used to automate more advanced image analysis tasks: isolating individual absorbance components from immunohistochemistry images and using the Trainable Weka Segmentation plugin to segment images statistically.
Many immunohistochemical stains contain two components, such as a diaminobenzidine pigment (brown) marking labeling antibody deposition and a haematoxylin (blue) counter-stain. Isolating each stain from a typical RGB image requires log-transforming the image to recover absorbance values on each channel, then applying a linear unmixing algorithm to apportion absorbance between the two pigments. Slide Set can automate this process using the Unmix Absorbances command.
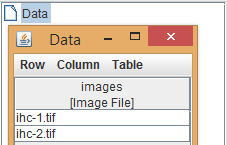
We begin with a new project containing immunohistochemistry images, which we wish to quantify.
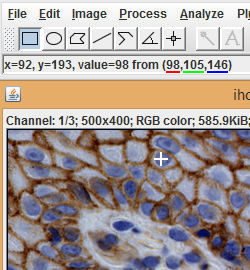
In order to separate the image, we will need to specify typical color values for each pigment. To estimate these parameters, we can open our images using the ROI editor (Table > ROI Editor from the Slide Set menu). When the cursor is held over an open image, the values of the pixel directly under the cursor are shown in the ImageJ status bar. Holding the cursor over an area of the image mostly stained with a single pigment gives the color of that pigment.
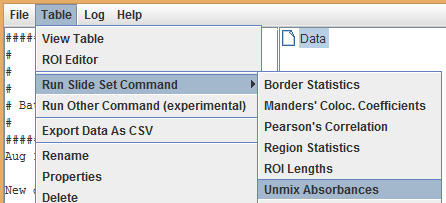
Once RGB color values have been obtained for both pigments, close the ROI editor. Select the data table in the project tree, then select Table > Run Slide Set Command > Unmix Absorbances from the Slide Set menu.
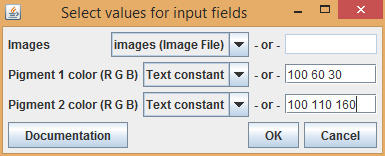
For each pigment, enter the color as space-separated RGB values. For example, enter 100 60 30 for a red value of 100, a green value of 60, and a blue value of 30.
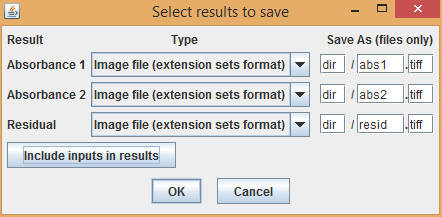
For each input image, three results images are produced: absorbance intensities on each channel and a residual map. Set file name patterns for each image, then select OK to run the command.
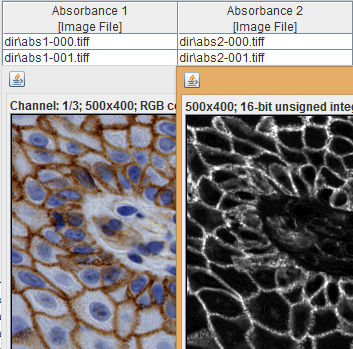
The resulting absorbance intensity images can be easily quantified using the Region Statistics and Border Statistics commands discussed in Examples 1, 2, and 3. Note that in many cases, some tuning of the pigment color values will be required in order to obtain satisfactory results.
The Trainable Weka Segmentation plugin included with Fiji (Plugins > Segmentation > Trainable Weka Segmentation) uses machine learning algorithms to produce pixel-based image segmentation. Slide Set contains a bridge command allowing this plugin to be included in an automated workflow.
Using the plugin in Slide Set requires that a classifier first be trained and saved as a .model file directly from the Trainable Weka Segmentation plugin. This process is described in detail in the plugin's web page. Once the classifier has been trained and the model file saved, return to Slide Set and select the table with the input images from the project tree. From the Slide Set menu, select Table > Run Slide Set Command > Segmentation > Trainable Weka Segmentation.
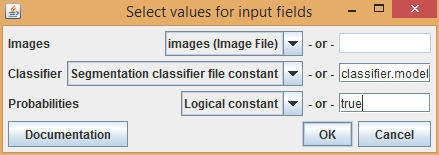
Enter the name of the model file in the Classifier input field. Setting Probabilities to true will return a map of the likelihood that each pixel belongs in each category of the classifier. Setting Probabilities to false will return a simple region mask. Select OK, set file names for the output images, then select OK again to run the command. Note that depending on your computer, the Trainable Weka Segmentation plugin may take a considerable amount of time to run.
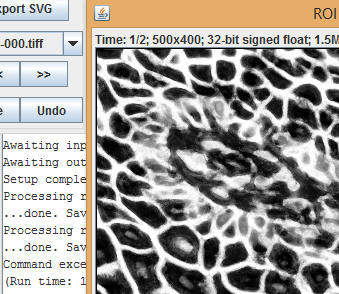
Once the command completes, the results table will contain probability maps or masks of the segmented images.
