This walkthrough demonstrates how Slide Set can be used to organize a data set and automate an analysis task over those images.
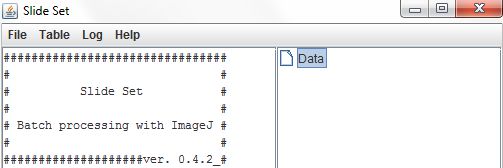
After Slide Set has been installed, it will be accessible from the plugins menu (Plugins > Slide Set > Launch Slide Set with ImageJ2). This will switch Fiji from ImageJ1 mode into ImageJ2 mode, and open the Slide Set launcher. The Slide Set launcher contains two panes. On the right, a tree diagram shows the relationships between data tables in the current project (it is empty until a new project is created or an existing project is opened). The panel on the left displays the log, which records information about the commands run during the session.
To create a new project, choose File > New... from the menu at the top of the Slide Set launcher and select a location to save the project's index file. The new project will contain a single empty table, named Data. To open the table, double-click on its entry in the tree, or select it and choose Table > View Table from the menu.
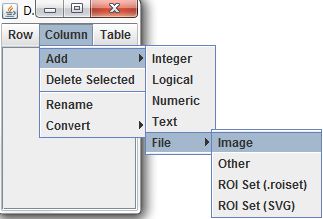
Slide Set table data is organized in columns based on data type. Columns can be added through the Column menu. We'll add a column for image files by selecting Column > Add > File > Image.
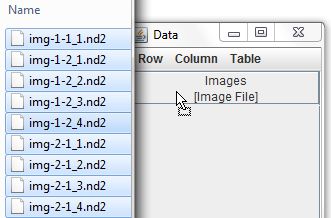
The easiest way to add image files to the new column is to drag the files from the file manager and drop them on the bar at the top of the column. We could also add empty rows by choosing Row > Add, and type in the image file names individually.
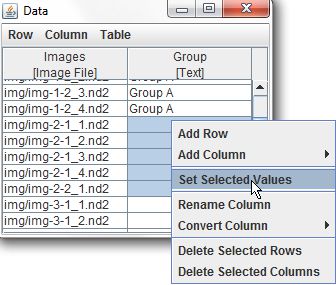
Let's create another column to contain a label for the experimental group of each image by selecting Column > Add > Text. Rather than entering each label individually, we can enter several labels at once by selecting the relevant cells, right-clicking, and selecting Set Selected Values from the popup menu.
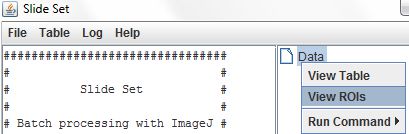
Slide Set's region of interest (ROI) editor can be used to identify the areas in each image that we want to analyze. To access it, close the data table, right-click on the table name in the Slide Set launcher, and choose View ROIs.
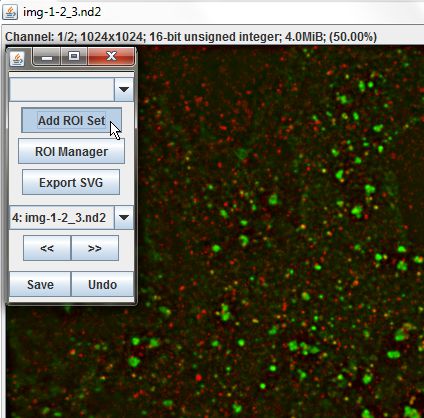
The ROI editor panel will open along with the first image listed in the tabele. There aren't any ROI sets yet, but we can create one by clicking the Add ROI Set button. By default, the regions we select will be automatically saved as SVG files in a folder named roi located in the same directory as the project's index file.
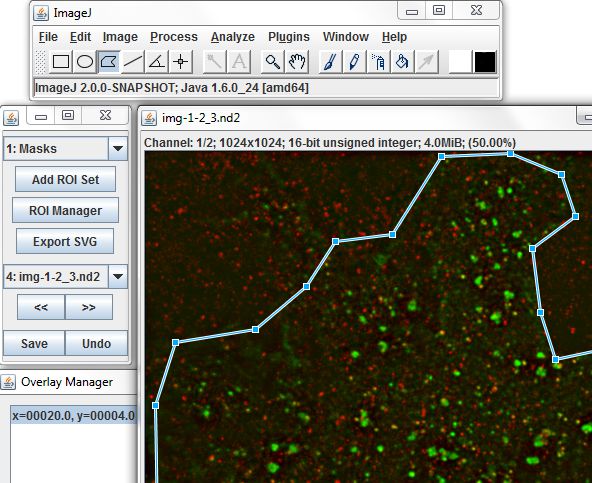
To select regions to include in the ROI set, use the selection tools in the ImageJ toolbar. Use the >> and << buttons or the drop-down list to cycle between images in the table. Click Save to write ROI set changes to disk. Close the image window or ROI editor panel when finished.
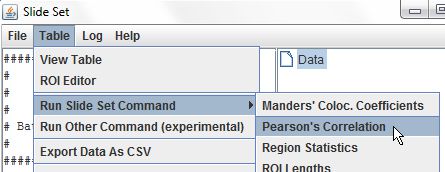
Now that we have organized images and ROIs in a data table, we can use one of Slide Set's built-in analysis commands to measure them. Let's look at the correlation between the images' two channels by choosing Table > Run Slide Set Command > Pearson's Correlation.
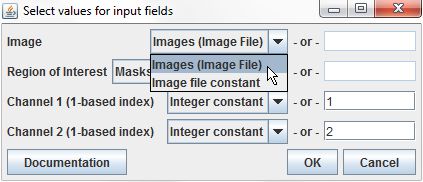
Setting up an analysis task in Slide Set requires two steps. First, the values of input parameters are set either from the input data table or constant values. The input fields dialog lists each parameter next to a drop-down box with possible ways the parameter can be set. For the Image and Region of Interest parameters, we'll choose the appropriate columns from the input table (only columns with matching data types are shown in the list). For the channel parameters, we'll enter constant values in the fields on the right. For more information about what each parameter does, click the Documentation button. Once all parameters have been set, click OK.
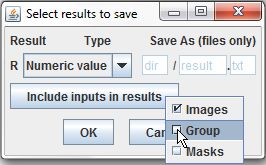
The second set-up step is to decide how to handle the results. The Pearson's Correlation command produces one result, the correlation coefficient, which will be stored in the results table as a numeric value (for more on results that are stored as files, see Example 3). We can copy fields from the input table into the results table by clicking Include inputs in results and checking the desired columns. To complete the set-up and run the command, click OK.
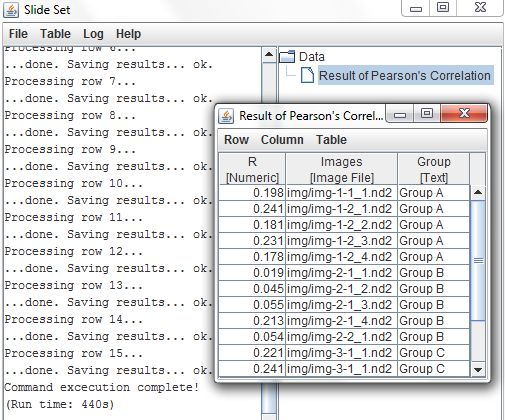
As the command runs, it's progress is tracked in the log pane of the Slide Set launcher. Once the command completes, the results are stored in a new table linked to the input data in the tree. To export the data as a comma-separated-values spreadsheet, select the table in the tree and choose Table > Export Data as CSV from the menu.
