This walkthrough demonstrates how Slide Set can be used for analysis tasks that produce outputs which cannot be stored directly in tables, such as image files and region of interest (ROI) sets. It continues with the same Slide Set project created in Example 1 and extended in Example 2.
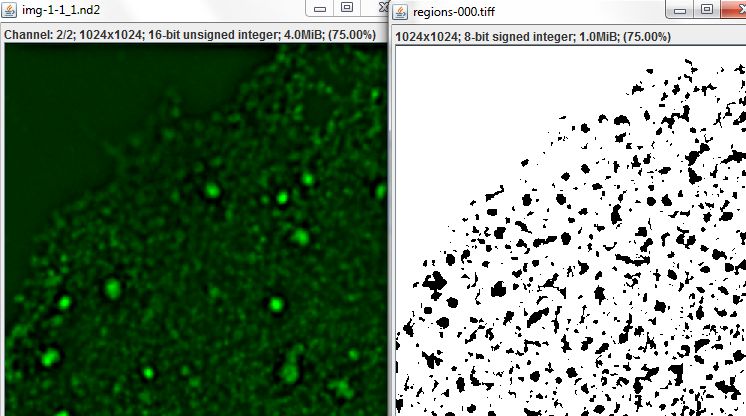
In Example 2, we calculated measures of colocalization describing, for each region, the proportion of pixels with above average values on one channel which also had above average values on the second channel. Now let's use the Threshold Segmentation command to outline those pixels which have above average values on both channels as regions of interest. To run the command, select the Result of Region Statistics table from the tree, and choose Table > Run Slide Set Command > Segmentation > Threshold Segmentation from the menu.
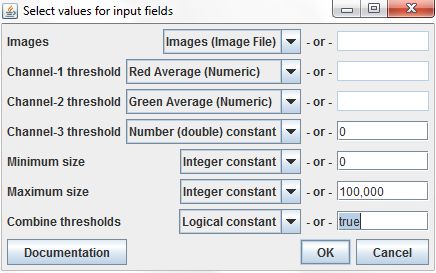
Set the Images input using the relevant column from the input data table, and set the Channel-1 and 2 thresholds using the Red Average and Green Average columns (the Channel-3 threshold can be ignored, since our images have only two channels). The Minimum and Maximum size parameters are set as constants. The Combine thresholds parameter is set to true, indicating that pixels should only be included in an ROI if their values on both channels exceed the respective thresholds.
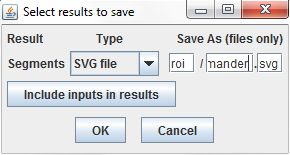
The results of the Threshold Segmentation command are ROI sets, which cannot be stored in the results table directly. Instead, we can store the ROIs in SVG files and record the file paths in the results table. The fields at the right of results dialog set the file names used to store the results. They define the folder where the files will be stored, relative to the directory of the project's index file, a base name for the files, and an extension for the files. As the command is repeated over each row in the input table, the result files will be numbered sequentially. We'll specify roi as the directory, manders as the filename base, and svg as the extension, so the files will be named <project directory>/roi/manders-000.svg, roi/manders-001.svg, etc.
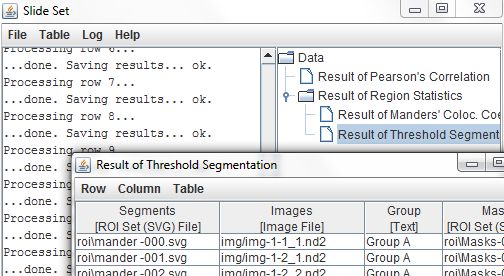
Once the command has completed, opening the Results of Threshold Segmentation table lists the ROI set files, along with the image files, group labels, and mask ROIs that were copied from the input table. Let's say we want to filter the segmentation ROIs to only include those regions which fall within the cell-outline ROIs we defined back in Example 1. We can do that by running the Table > Run Slide Set Command > Segmentation > Filter Regions command on the Results of Threshold Segmentation table.
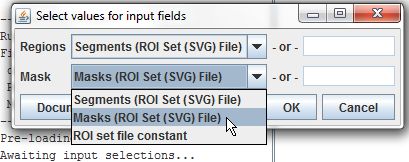
This command takes two different ROI sets as inputs. Regions are the ROIs which will be filtered, and we'll set them using the Segments column from our input table. Mask is the ROI set used to define the filter, and we'll set it using the Masks column.
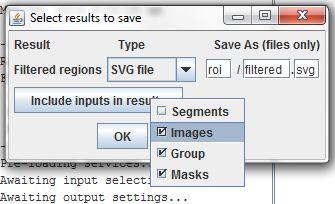
As with the Threshold Segmentation command, the output of the Filter Regions command is an ROI set. To make sure these new ROI files do not overwrite any existing ROI files, we'll set a new base filename, filtered. Again, we'll copy data from the input table for further use.
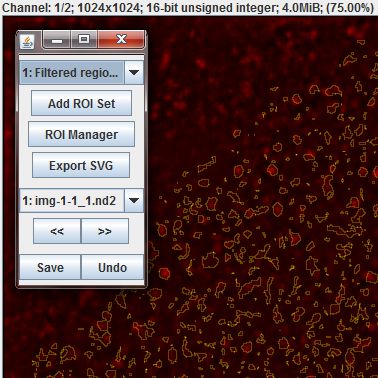
The Result of Filter Regions table now contains ROI sets for each image that have been defined by segmentation on average channel values and filtered through the cell-outlines we drew earlier. These regions can be seen in the ROI editor, but so many small regions can be difficult to work with. An alternative is to use the Table > Run Slide Set Command > Segmentation > Create Mask Image command to convert the region outlines into a rasterized mask image.
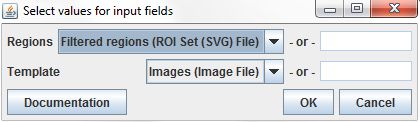
The Create Mask Image command requires two input parameters. The Regions parameter specifies the regions used to create the image. We'll set it to the Filtered regions column from our input table, which is the result of the Filter regions command. The command also requires a Template parameter, an image that will be used as the size template for the resulting mask images. We'll set it with our original image files.
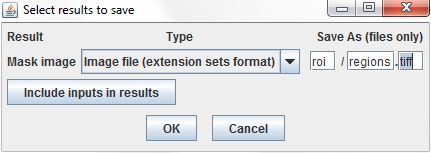
Like ROI sets, image data are stored as linked files rather than directly in the results table. We'll set a filename pattern, and use the tiff extension to tell ImageJ to save the images using the TIFF file format.
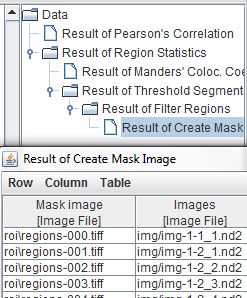
The results table now links the mask images we've created with the original images they were created from, and the entire chain of operations that created the masks is visible in the Slide Set launcher tree pane.
Automating general ImageJ2 plugins