This walkthrough demonstrates how Slide Set can be used to chain multiple commands together to create a more complex analysis while keeping the dependencies clear. It continues with the same Slide Set project created in Example 1.
In Example 1, we calculated the correlation between pixel values in two channels of our images. In this example, we'll calculate another measure of the relationship between the two channels: the proportion of pixels above the mean value on one channel that are also above the mean value on the second channel. We can do this by first calculating average values in each of our regions of interest (ROIs), and then using those values as thresholds to calculate Manders' colocalization coefficients.
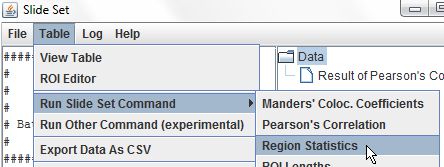
We can calculate average values on each channel by selecting the original data table in the tree, and choosing Table > Run Slide Set Command > Region Statistics.
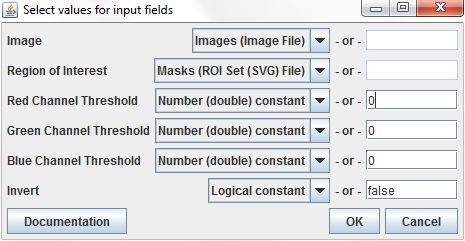
The Image and Region of Interest parameters can be filled from the appropriate columns in the input table, and the other parameters are set to constant values.
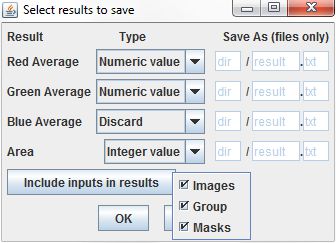
We'll make two changes to the defaults in the command output dialog. First, we can choose to discard the Blue Average result, since our images have only two channels. Second, we use the Include inputs in results button to select each of the columns from the input table to copy into the results. This will give us access to them later when we run the Manders' Coefficients command.
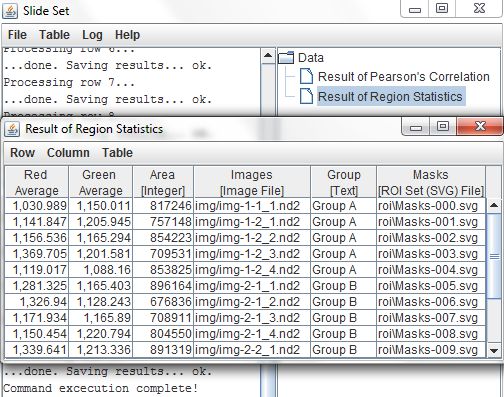
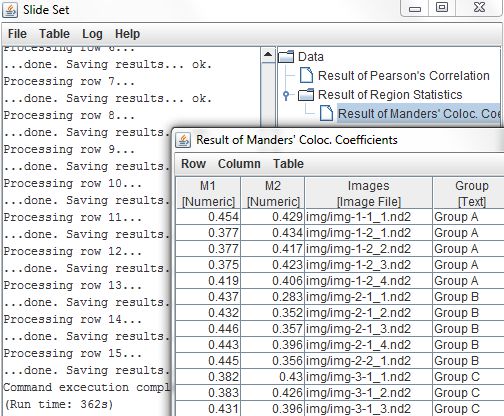
The results table contains the outputs from the Region Statistics command, Red Average (channel 1), Green Average (channel 2), and Area, as well as the data copied from the input table, the image files, ROI files, and group labels.
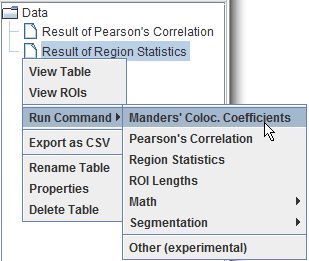
Now that we've calculated average pixel values within each of our regions, we can use those values as thresholds for the Manders' Colocalization Coefficients command. To run the command, right-click on the Results of Region Statistics table from the tree and choose Run Command > Manders' Coloc. Coefficients from the pop-up menu.
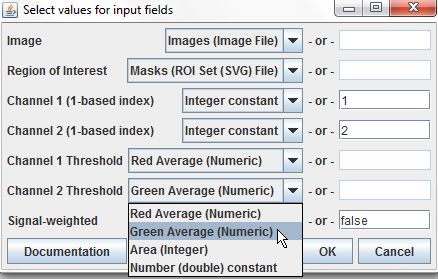
This command's input fields are set similarly to those of the previous command. As before, Image and Region of Interest are set to the appropriate table columns and the channel indexes are changed to constant values of 1 and 2. However, we will set the Threshold parameters not with constant values, but with the Red Average and Green Average columns from our input table. This will allow the command to use the previously calculated averages for each region as thresholds without having to enter them all individually.